Analytics dashboard
Track product-level performance — CPA, revenue, and spend — and explore your creative performance base.
Open in appThe analytics dashboard is AdFactory's performance library — a single view that connects every ad you're running back to the creative behind it. Pick a product and a date range, and you get a scored, sortable table of real campaign performance: CPA, revenue, spend, and the full funnel in between.
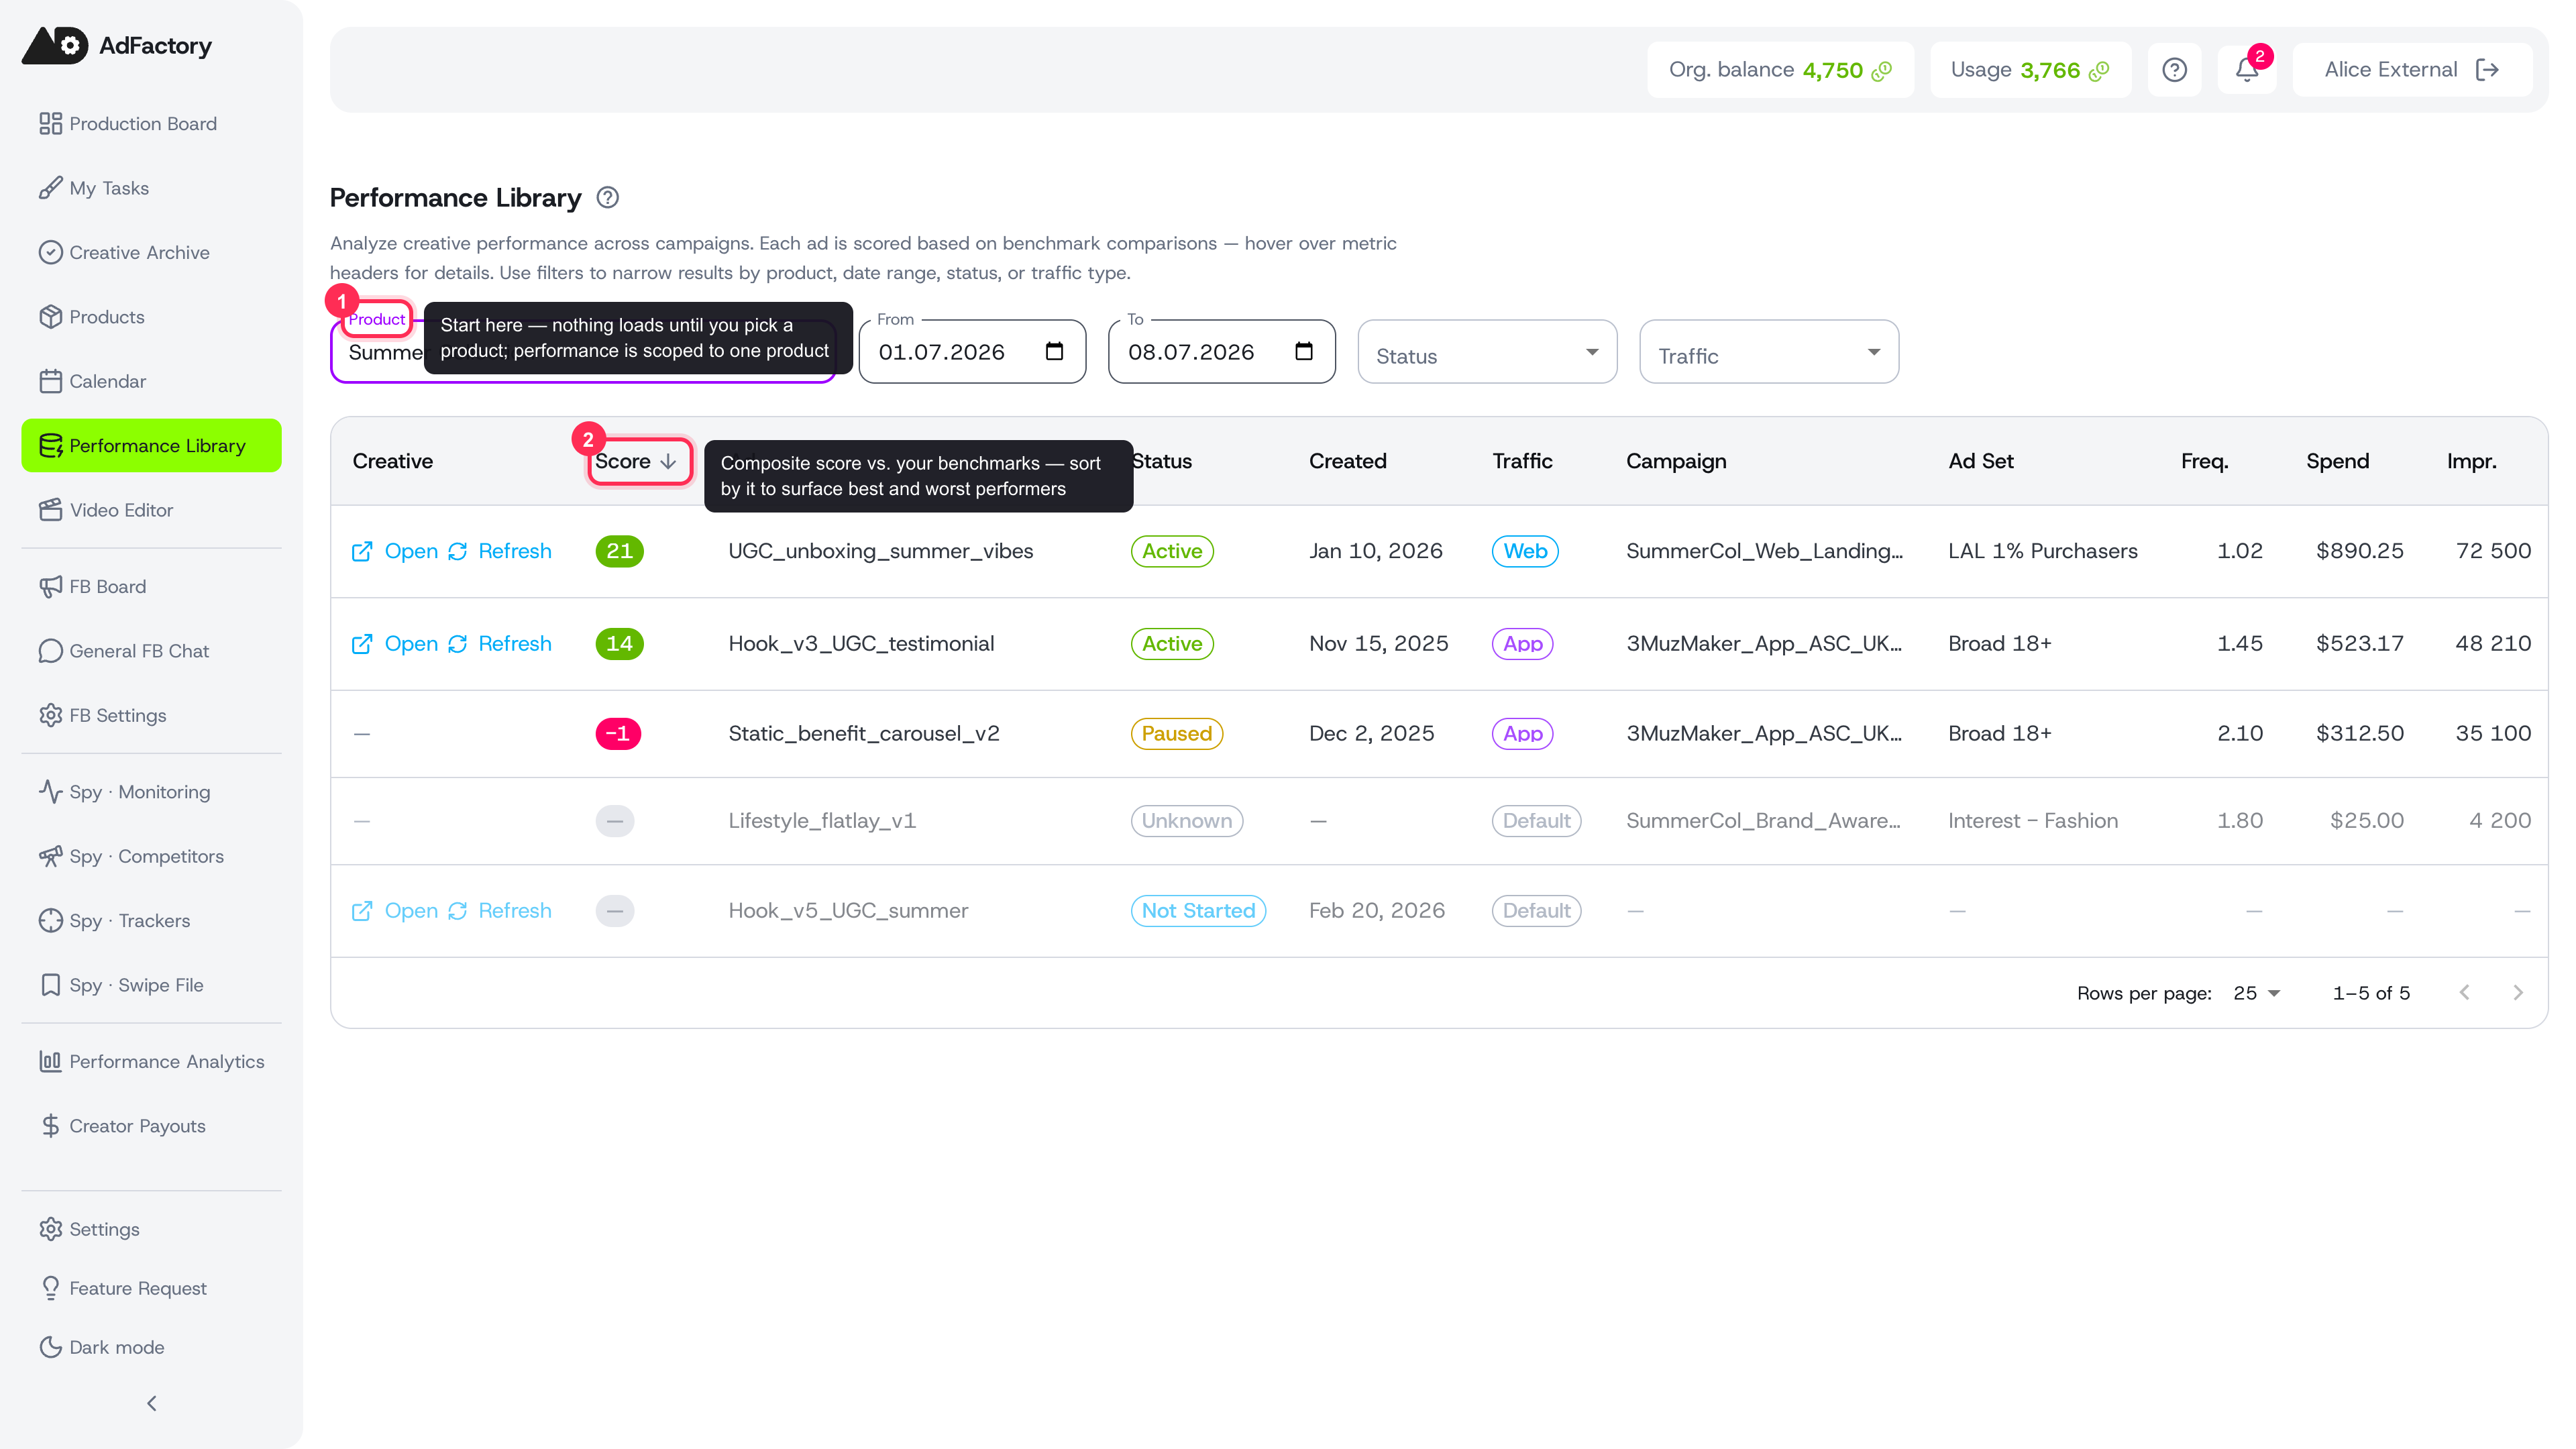 Pick a product and date range to load a scored, sortable table of every ad's real campaign performance
Getting started
The dashboard is built around two choices at the top:
- Pick a product. Performance is always scoped to one product at a time, so nothing loads until you select one.
- Set a date range. It defaults to the last 7 days. Use the From and To fields to widen or narrow the window.
Your product, date range, and filters are remembered, so the dashboard reopens the way you left it.
Reading the table
Each row is one ad, with its name, current delivery status, creation date, traffic type, and the campaign and ad set it belongs to. Across the row you'll find the full metric set:
- Spend, revenue, and CPA — the headline economics of each ad.
- Funnel rates — hook rate, hold rate, complete rate, CTR, and view-to-lead.
- Outcomes — clicks, leads, subscriptions, ROAS, and ARPPU.
Hover any column header for a plain-language description of that metric. Click a header to sort by it.
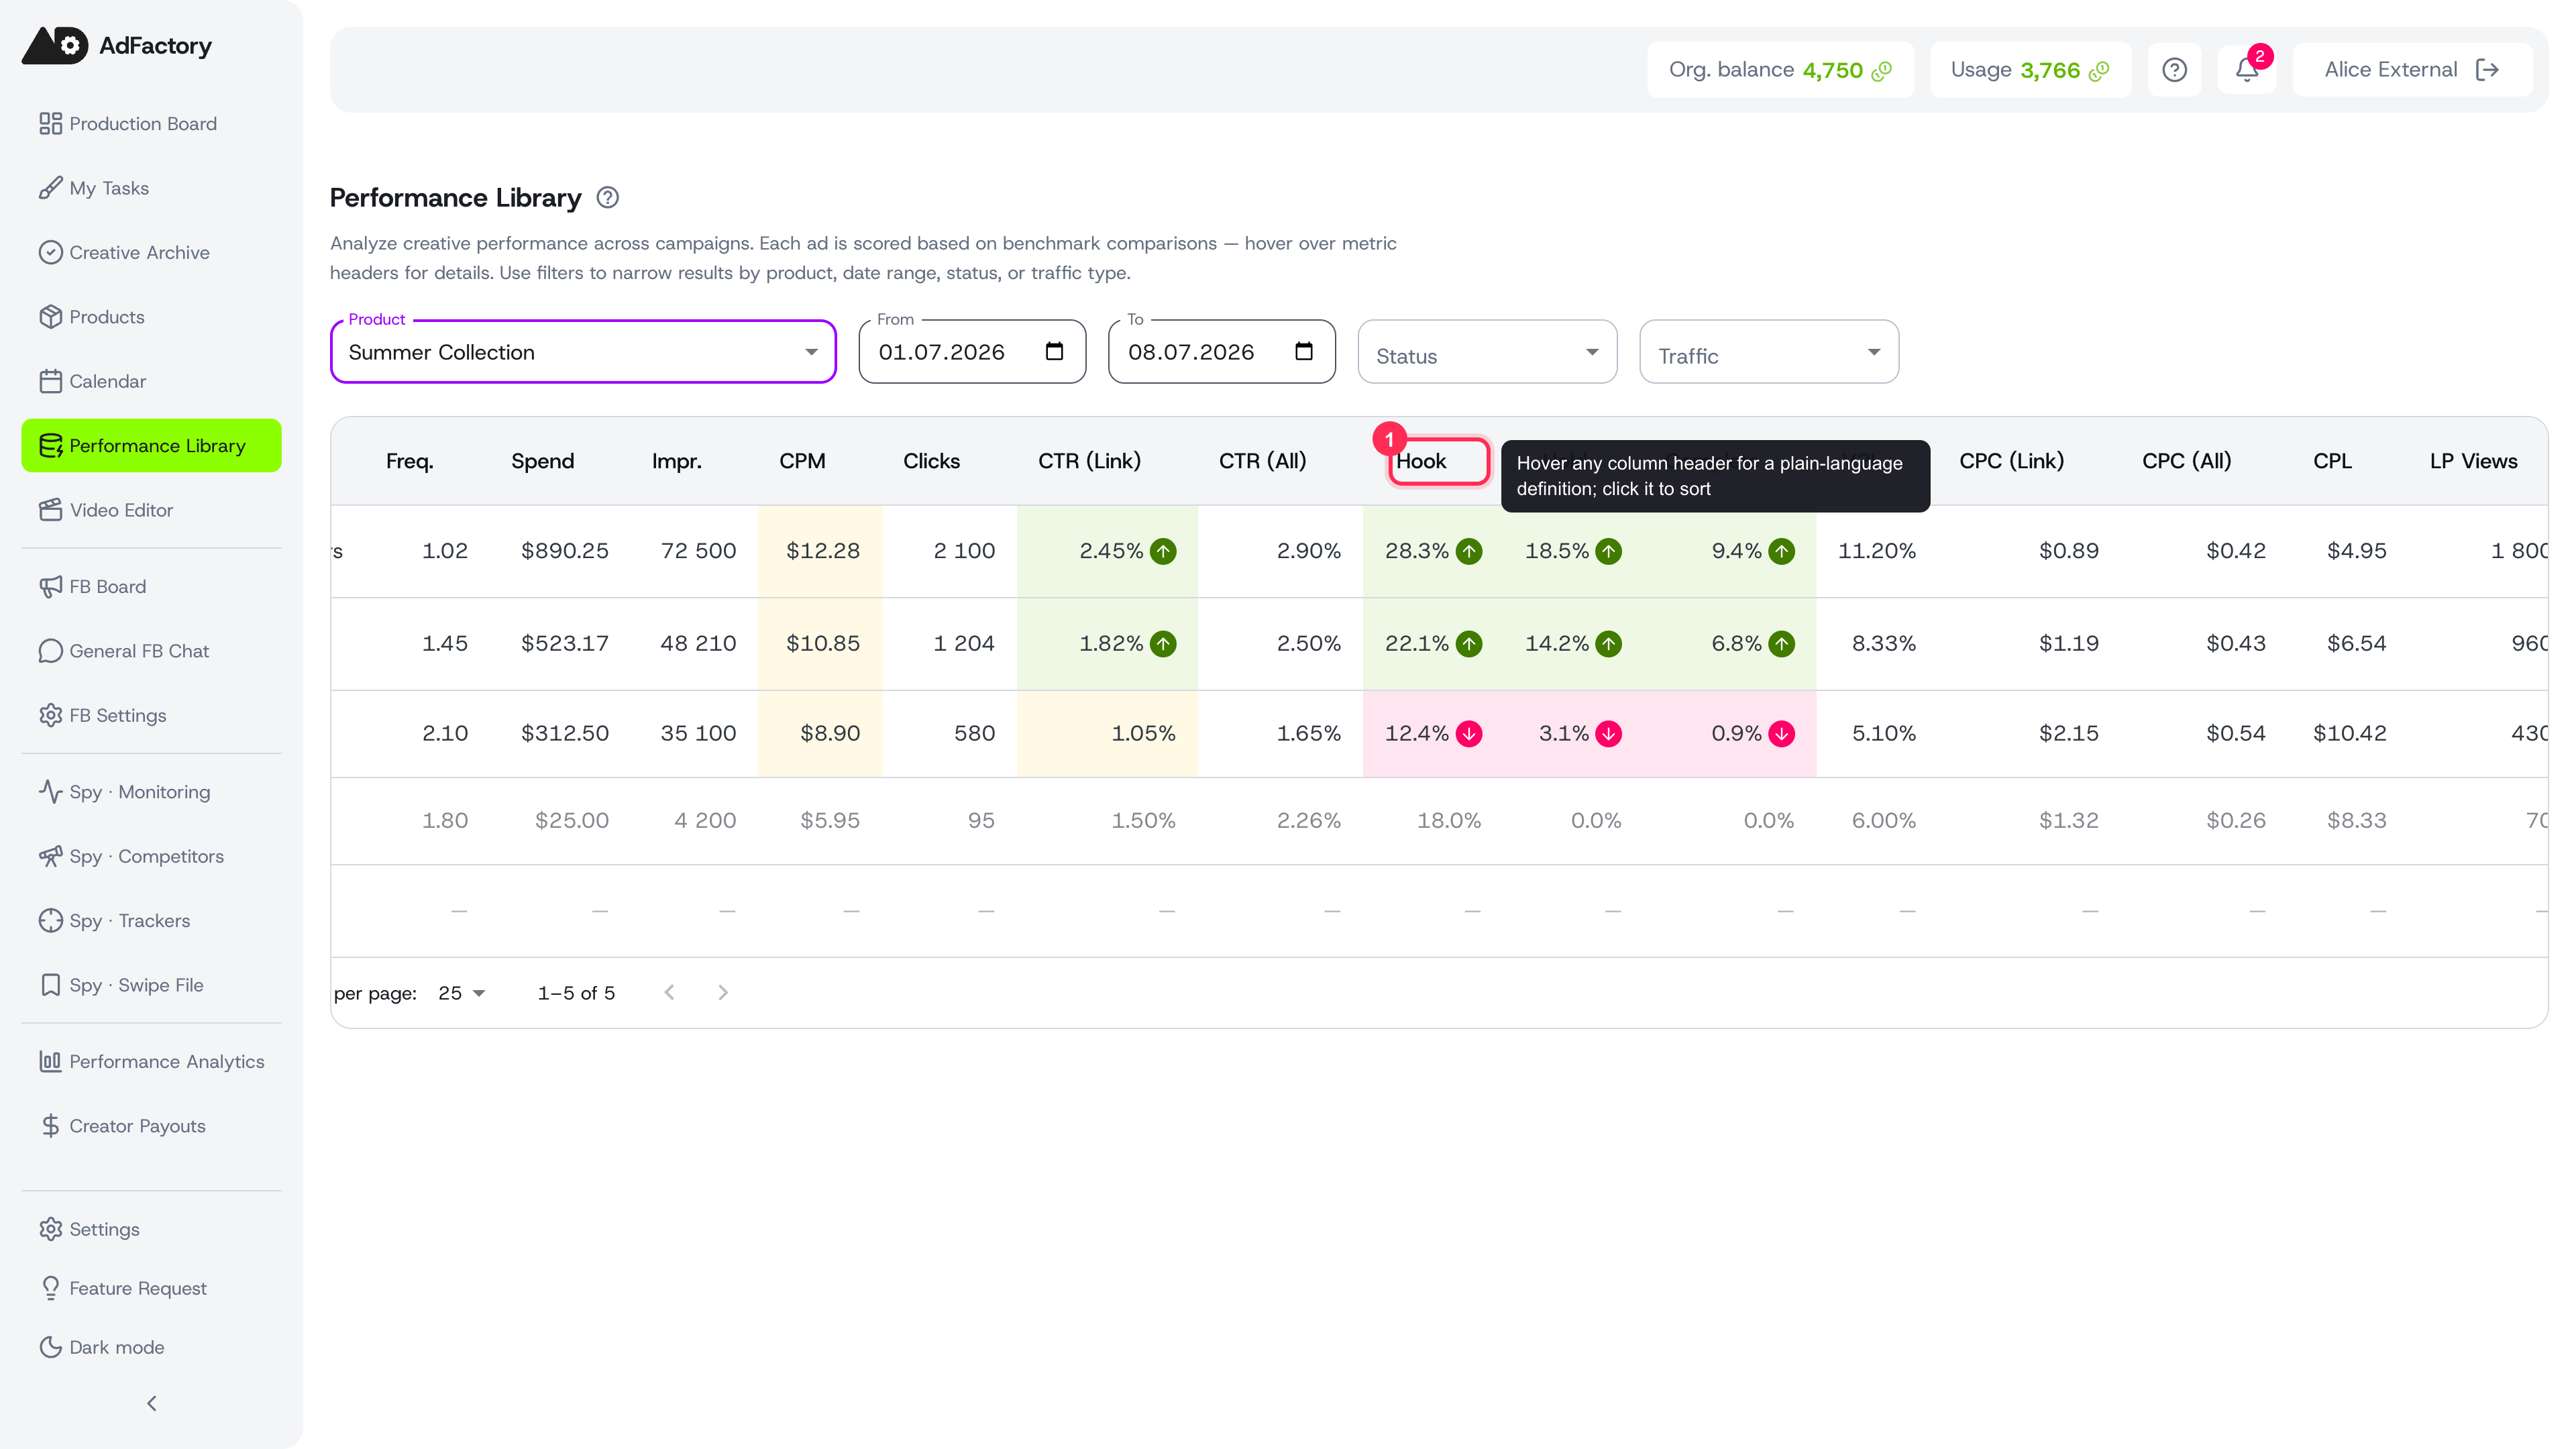 Funnel metrics with green up and red down indicators showing which metrics pulled each ad's score up or down
The performance score
Every ad gets a composite score based on how its metrics compare to your per-product benchmarks. A positive score means the ad is beating your averages; a negative score means it's underperforming. Up and down indicators next to individual metrics show which ones pulled the score in each direction, so you can see why an ad is winning or losing at a glance.
Ads without enough data to score fairly are dimmed and sorted to the bottom.
Filtering and focus
Narrow the table to what matters with the Status and Traffic filters — for example, only active ads, or only app-install traffic. Combine them with the product and date range to isolate a specific slice of performance.
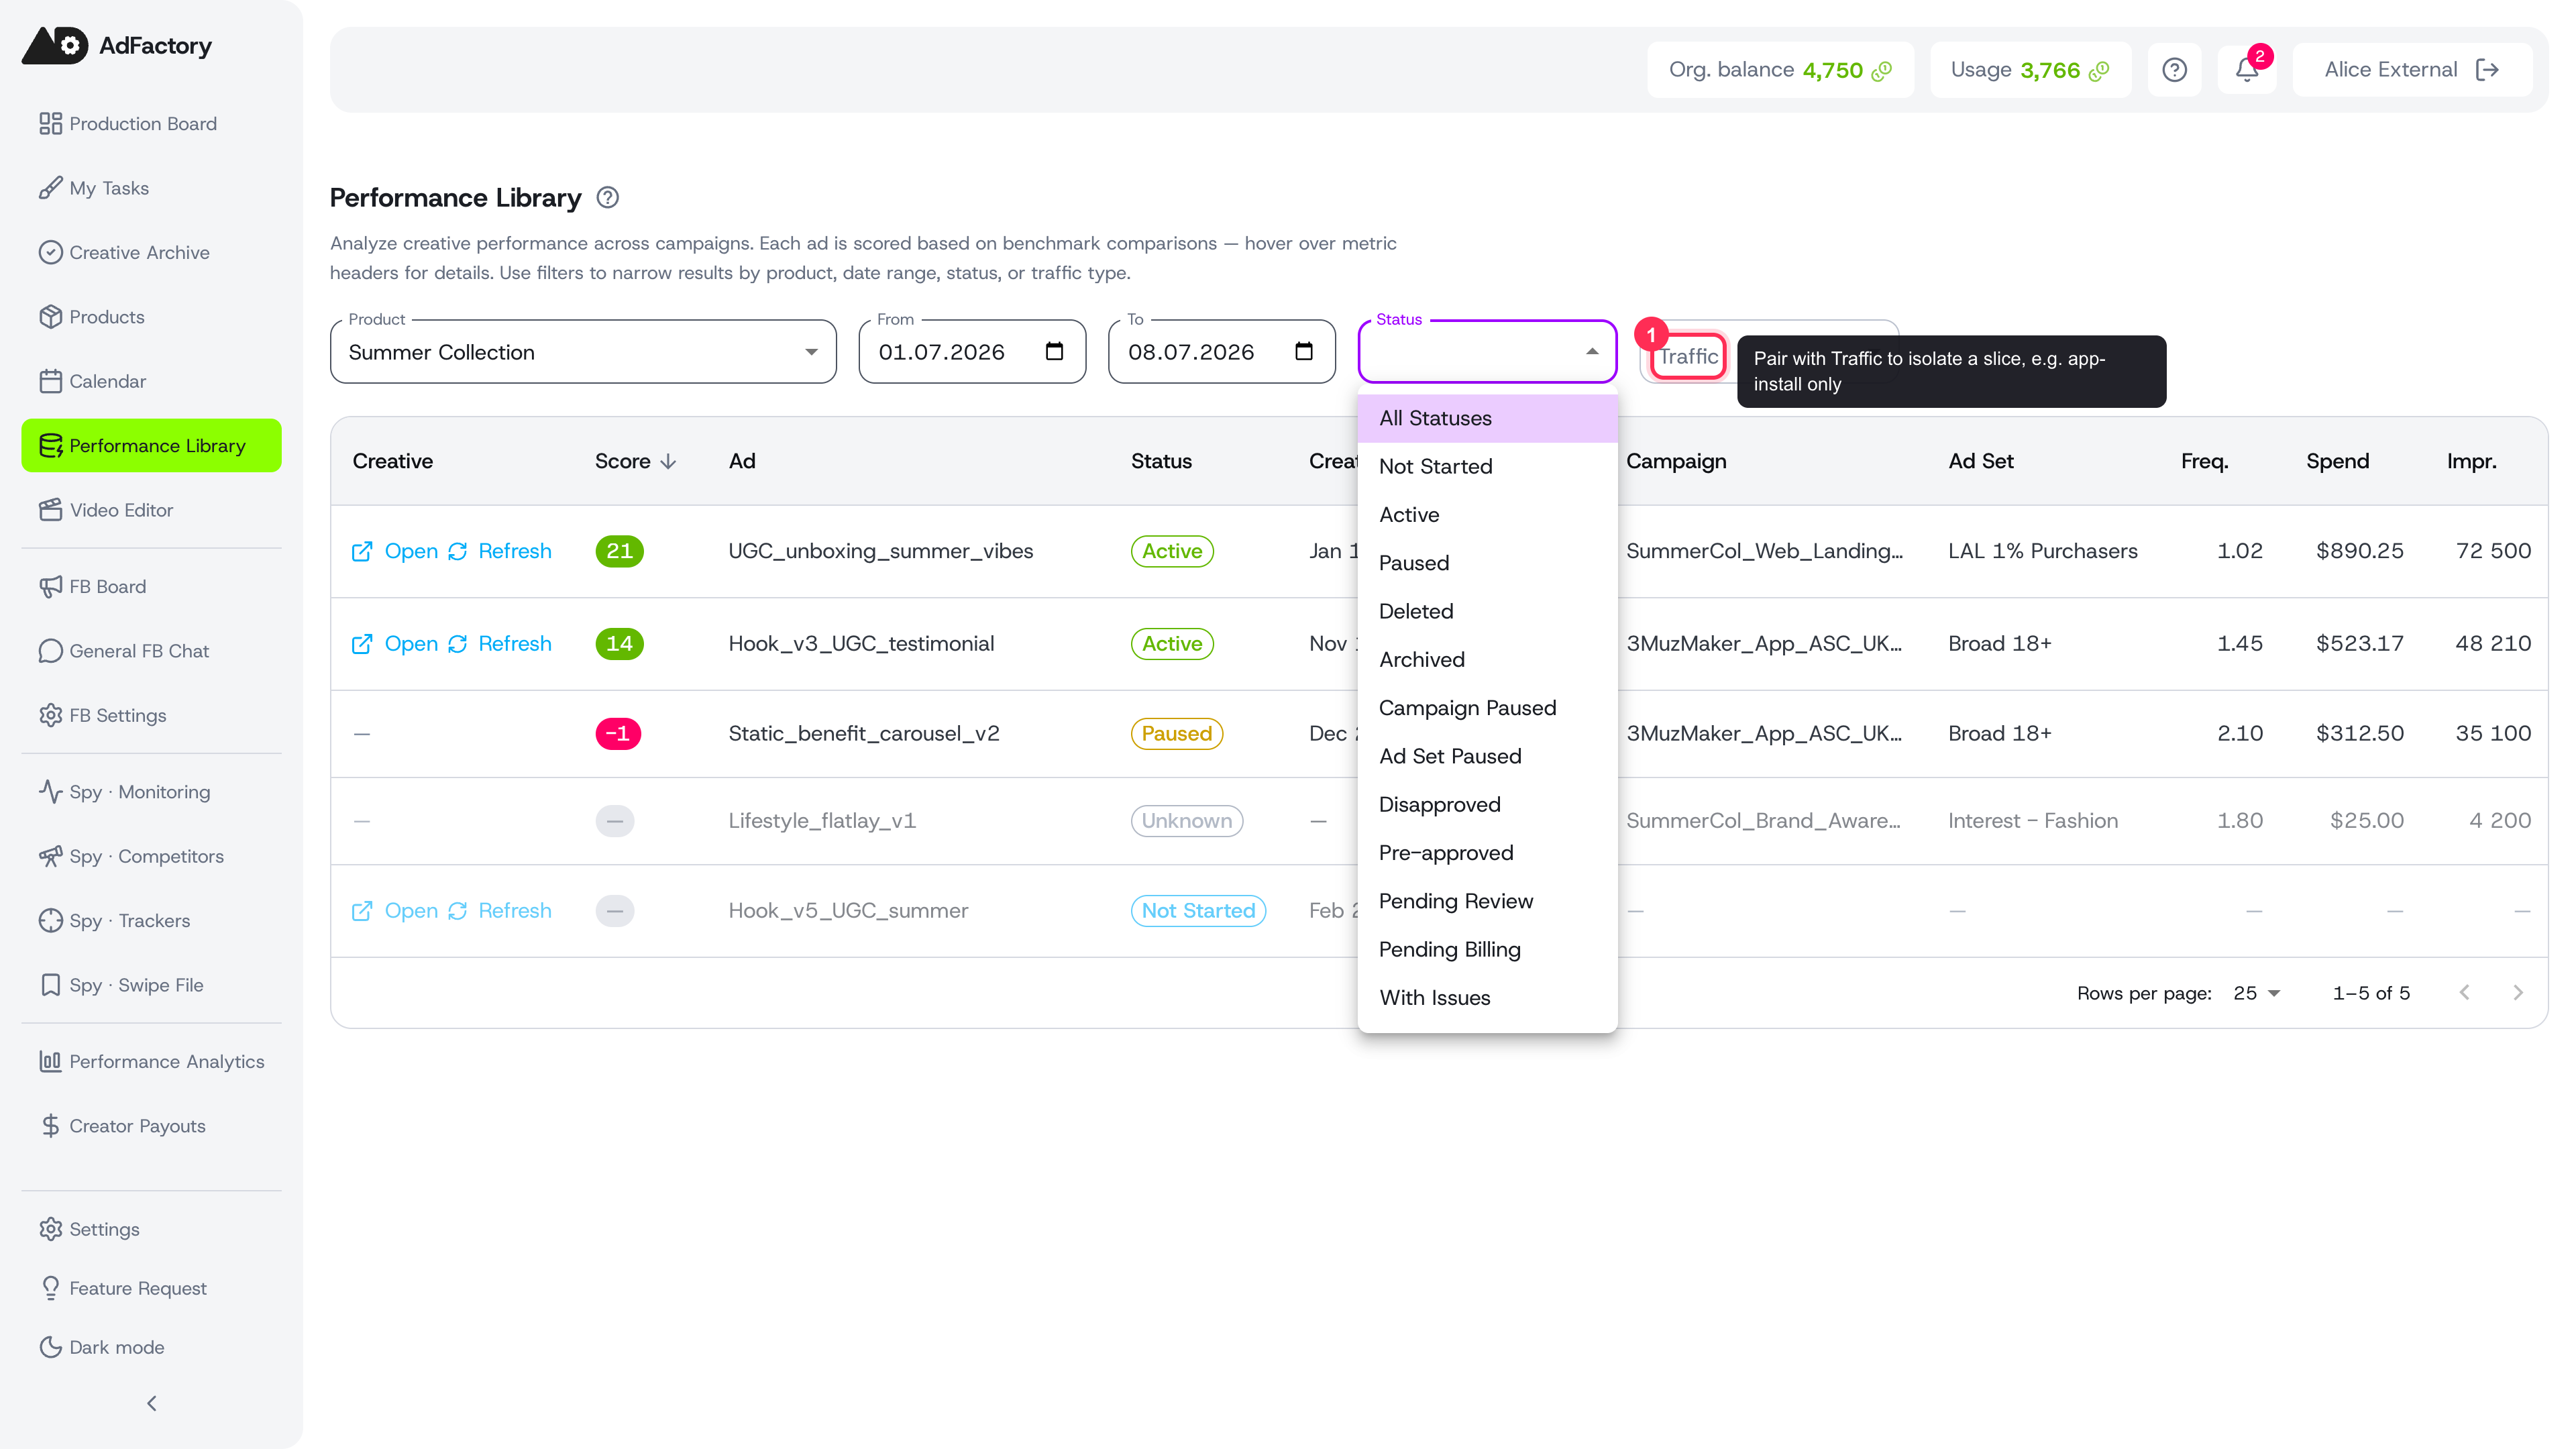 The Status dropdown open with delivery states, alongside the Traffic filter
From data back to production
The dashboard isn't just a report — it closes the loop with your creative work:
- When an ad is linked to a creative in AdFactory, click Open to see its creative detail without leaving the page.
- For a top-performing approved creative, use Refresh to spin up a variation brief — a new task with draft creatives — so you can scale what's already working.
Tips
- No rows? Make sure your campaigns match the product and that performance data has synced for the selected dates.
- Sort by Score to surface your best and worst performers fast, then drill into the metrics behind them.
- Pair the dashboard with benchmarks to keep your targets honest as performance shifts.